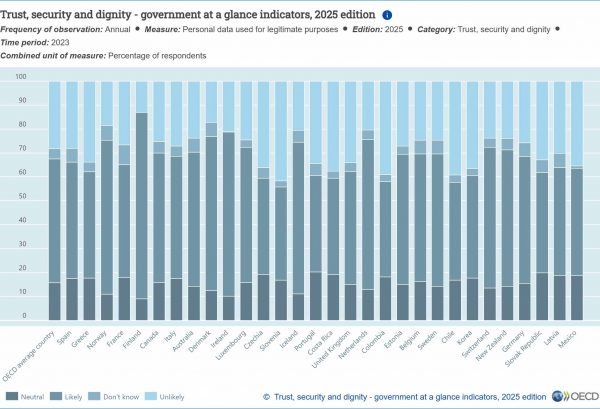
Study Wages

There is a remarkable study of sectoral minimum wages in California. It deals with minimum wages that have been raised set to start from a floor of $20 per hour in the fast food sector. The first indications after 6 months show that the wage increases due to the regional and sectoral minimum wage in California were about 18% per hour. The wage rises did not have a negative effect on employment so far and are not expected to happen. The first indications suggest that price rises absorbed 2/3 of the wage increases. Consumers of the fast food chains and on special event locations do not react strongly on the price increases to reduce demand. As overall the turnover achieved in the restaurants increased even franchising chains were able to increase their profits. It is an interesting example that an increase in minimum wages can create a win-win-win situation starting with a substantial pay rise. A second round effect not mentioned in the study could consist in the narrowing of the price differential between healthy food and fast food. The option of a healthy meal might no longer appear to be so much more expensive.

Ausblick 22

Vor dem Ausblick steht meist der Rückblick. Die Satireproduzierenden bereiten schon den Jahresrückblick vor. Da habe ich mir mal wieder die Frage gestellt, was bleibt von 2021. Beim Stöbern in Bibliotheken und Archiven dazu, hat mich die Sammlung von Zeitschriften des „Economist“ von vor 4 Jahren beeindruckt. Hat sich doch an den Fragen und Themen von vor 4 Jahren wenig geändert. Es war nicht nur 1 verlorenes Jahr, es waren gleich 4 davon. Aber langsam, was waren damals die Themen für Titelblätter? Und heute? Visual Social Science ist ja schon eine neue Forschungsrichtung und die Macht der Bilder ist beeindruckend. Eigentlich wussten wir, was auf uns zukommt. Das Image für Corona war auch schon mit China verbunden, nur eben als Stahlkugel statt als schleichendes Virus. Lügen über Klimawandel waren ebenfalls Thema der Presse. Noch Fragen? Nur bitte kein Weiterso!

Covid-19 USA

With almost 6 months into COVID-19 in the USA since the first official case, the public health situation is still scary. Data and figures from the official U.S. Department of Health & Human Services, particularly the recent data release from the Centers for Disease Control and Prevention show around 50.000 new cases of Covid-19 every day again (see figure).

By using the data and calculating a simple linear trend shows the following evolution in case no policy change occurs.

Using a seasonality in the calculation of about 3 weeks (=20days) the evolution looks much different with huge margins of error.

Hence, all is possible by chart analysis or the language of investors. Public health analysts would rather look at the disaggregated state by state or even county be county detailed analysis. A seasonality of 3 weeks could make sense. With a high level Covid-19 cases in one state people move (also with Covid-19) to other states for one week exporting the virus. After 2 more weeks incubation, case numbers rise in this receiving area, which will make visitors (and the virus) move back again. A oscilating pattern of the spread of the virus will result, making a nationwide lockdown much more likely. In natural sciences (Video-Link)we call this coupled oscillation, here of Covid-19 between several US-states. (take Florida and New York for example).
Now, let us apply the same simple statistical modelling to the international level. As we enjoy Summer in Europe , in the southern hemisphere of the world Winter, Covid-19 and the flu are spreading there now. When we shall move from Autumn to Winter, we might receive another wave of cases from the other part of the world.
Conclusion: Get prepared for another wave as of now. Helping the global South now, saves lives in Autumn and Winter also in Europe. Simple isn’t it. Let’s just act accordingly (the not so simple part). Train health care professionals (95.000 of them got infected in the US and 500 !!! died).