

With almost 6 months into COVID-19 in the USA since the first official case, the public health situation is still scary. Data and figures from the official U.S. Department of Health & Human Services, particularly the recent data release from the Centers for Disease Control and Prevention show around 50.000 new cases of Covid-19 every day again (see figure). 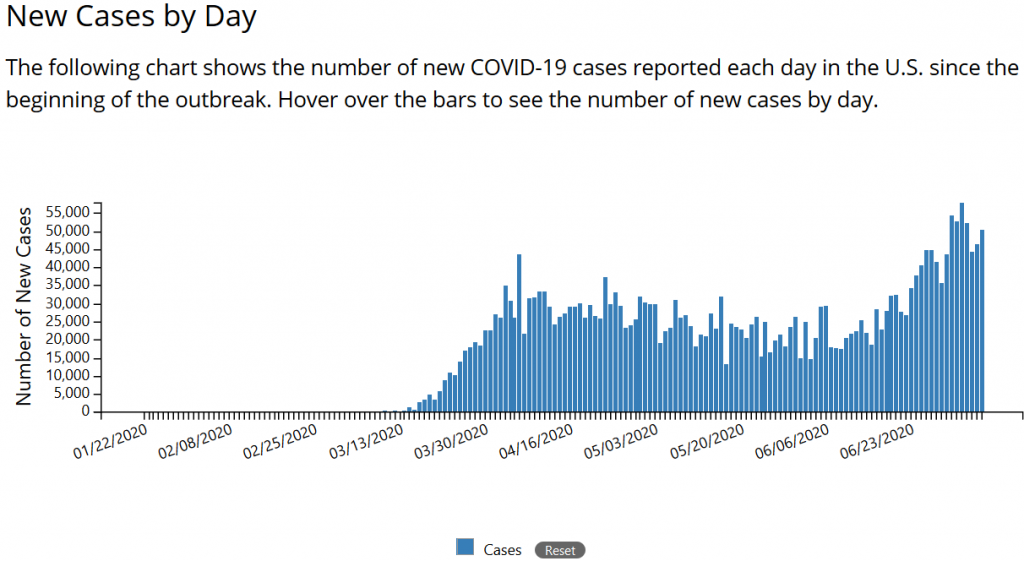
By using the data and calculating a simple linear trend shows the following evolution in case no policy change occurs. 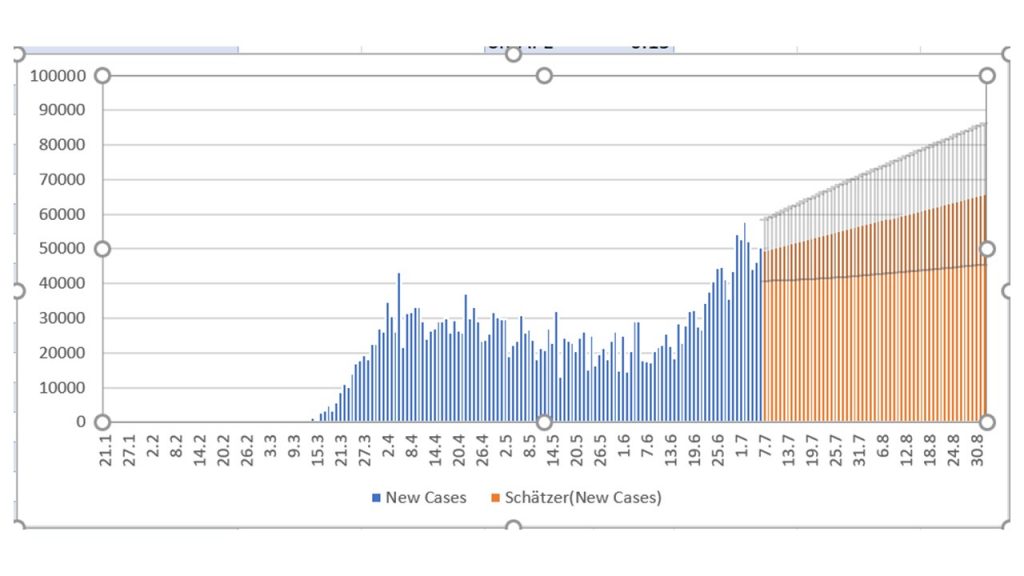
Using a seasonality in the calculation of about 3 weeks (=20days) the evolution looks much different with huge margins of error. 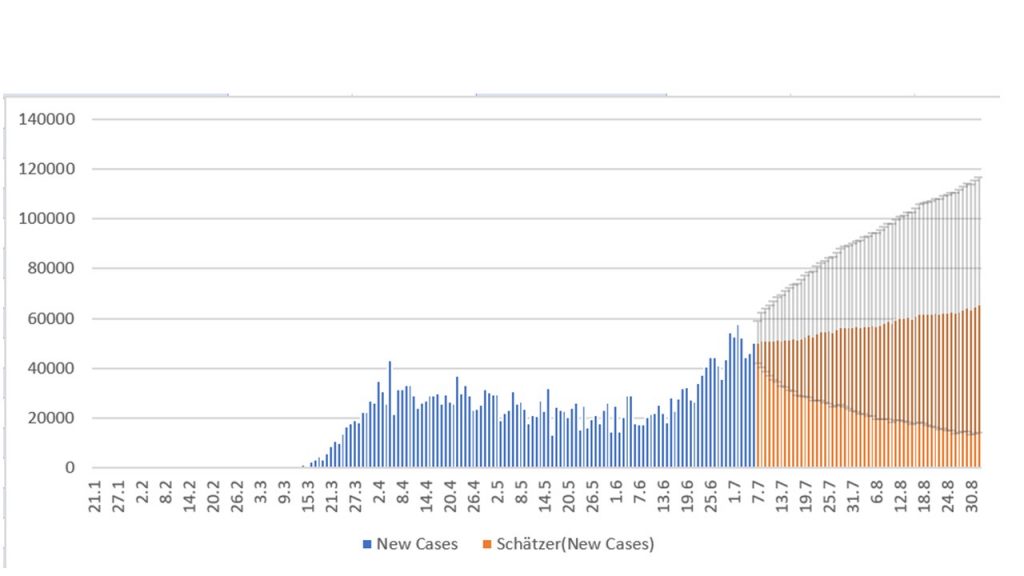
Hence, all is possible by chart analysis or the language of investors. Public health analysts would rather look at the disaggregated state by state or even county be county detailed analysis. A seasonality of 3 weeks could make sense. With a high level Covid-19 cases in one state people move (also with Covid-19) to other states for one week exporting the virus. After 2 more weeks incubation, case numbers rise in this receiving area, which will make visitors (and the virus) move back again. A oscilating pattern of the spread of the virus will result, making a nationwide lockdown much more likely. In natural sciences (Video-Link)we call this coupled oscillation, here of Covid-19 between several US-states. (take Florida and New York for example).
Now, let us apply the same simple statistical modelling to the international level. As we enjoy Summer in Europe , in the southern hemisphere of the world Winter, Covid-19 and the flu are spreading there now. When we shall move from Autumn to Winter, we might receive another wave of cases from the other part of the world.
Conclusion: Get prepared for another wave as of now. Helping the global South now, saves lives in Autumn and Winter also in Europe. Simple isn’t it. Let’s just act accordingly (the not so simple part). Train health care professionals (95.000 of them got infected in the US and 500 !!! died).
One Reply to “Covid-19 USA”
Comments are closed.