Webpage Analytics

I do not collect data of detailed webpage analytics. Therefore, I thought I do not know anything and do not want to know anything about webpage visits of this webpage. However, the most basic information of how many times the webpage is visited per months is given by the hosting service of the webpage. The previous jump beyond 20.000 visits/month had the implication to move the security level of the webpage for me and all visitors to a higher level. Additional information of how many seconds an “internaut” is staying on the webpage tells, maybe a little bit about the interest in the content or image of a specific entry. Reaching 84.000 visitors/month was a surprise that asks for an explanation. Apparently, the most visited page is the blog entry on “geo-politics”. The longest time people stayed on a page or blog entry is a recent entry on “nutrition policy”.
Other statistics show that people who visited an entry on “find trust”, trusted in the webpage to click on many other entries or pages on “www.schoemann.org”.
I do not collect data or statistics on where visitors go after a visit. The hosting service, however, measures the so-called “jump-off” rate. This indicates the importance of the webpage as spring board to jump to other pages on the internet. It is usually = 1, just showing that you left somewhere. For some pages this reaches higher levels according to the number of links you offer on a blog entry, for example. It gives an indication whether you manage to lead on readers to explore the topic further. This is a usual evaluation question of lectures and seminars given at universities.
Last but not least, even without collecting any “real data” about visitors, it is part of the minimum information your browser transmits is the “operating system” used for access. Your smartphone provides the information on IOS, Android, Linux, or Windows versions used. These technical purposes remind me that there are still vast amounts of users of what we believe are outdated operating systems. Windows 7 and Windows 10 are still heavily in use across the globe. The hype around the latest operating system and smartphone is most likely only a phenomenon of the rich and wealthy in the rich parts of the western world. This reminds me to include images, which are small in data size to allow fast downloads in all parts of the world. We should embrace this as an important topic of geo-political relevance.

Science Transparent

Every year there is only one special big event (Lange Nacht der Wissenschaften) to make science more transparent to the population at large. Mostly hidden behind impressive walls and buildings guarded by porters,
science is not as transparent for the large public as it would like to be. In general people are rather intimidated or feel quickly out of place if scientist start to “explain” in lengthy formats their topics, ideas, questions and intermediate solutions. Even if the distributed open science fair is running only from 5 p.m to midnight, there are lots of things to learn and look into.
The website lists 1500+ sessions, 230 are in English language. You have to be selective or spread your interest over several years. I chose to start with, maybe, the toughest choice the Weierstrass-Institute near the Naturkundemuseum. Several projects of applied mathematics and stochastic processes were exposed and explained in more or less transparent and/or understandable form to the audiences. The talk by Julian Kern “Why chance doesn’t happen by chance” had a nice interactive format with “Kahoot-quizzes” and gave a good introduction, why it is useful to understand, statistics and stochastic processes in fields from biology, physics to social phenomena. The White board replaced already the black board and chalk.
The open doors policy, at least one day per year, raises interests and awareness for topics few people would only think that they existed already. The  volume “Mathematics and Society” (Wolfgang König ed. 2016) is something I shall follow up on eventually. There are lots of applications of mathematics to social phenomena (time seen from the perspective of generations for example, image below from talk), which we have a hard time to come to grips with without the aid of mathematicians.

Forecasting floods

As floods as becoming more frequent and more severe forecasting of such events is crucial. The recent example in Bavaria (Germany) of the Danube river (2nd longest in Europe) has demonstrated the role of forecasting to spur adequate behavior of people living in areas at risk of flooding. With the weather forecast announcing lots of rain for a large area the forecasting of floods needs to follow closely these trends. It is not only a question of expectations, but an issue of adaptive expectations for people to adopt appropriate precautions. In retrospect the early forecasts turned out to be fairly accurate in terms of the peak of flooding to be expected in June 2024. The Bavarian “Hochwassernachrichtendienst” (no joke, one word) forecasted on the 2nd of June about 7.50 as the peak to be reached in 2 days in the city of Kelheim. This was beyond the usual 4 warning levels based on an escalation scale. The forecast was beyond the frequent flooding levels established in the last decades. People and emergency services would have to adapt their expectations accordingly. Renewing forecasts is essential to guide people and services in their efforts to deal with emergencies and repair damages as flood levels recede. Management of crises critically depends on forecasting even if they are obviously prone to error margins which should usually be reported as well just like in weather forecasts. Adaptive expectations are key in combination with forecasts to ensure survival.

Hochwassernachrichtendienst Bayern 2024-6
Kelheim on Danube

Testing

In winter times we rely more frequently on test to find out about sickness. Covid-19 testing has proven pretty effective in this respect. Often it is preferable to test more persons positive if at the risk of having many false positives. False negative tests can have many fatal consequences. Hence we have to weigh the risks of both kinds of false tests. This applies to many other diseases and diagnoses as well. There is no certainty but only a probability of each of the test results. The true result may deviate from the observed or tested result. FF FT TF TT are the possible outcomes of (1) the underlying true or false outcomes, which can have test scores of true or false as well. Not much new here the rest is statistics or probabilities to be more precise.

The overall outcome of testing or true sickness for some only God may know. Cancellations of events may be the result of one or the other reasoning.

On Noise

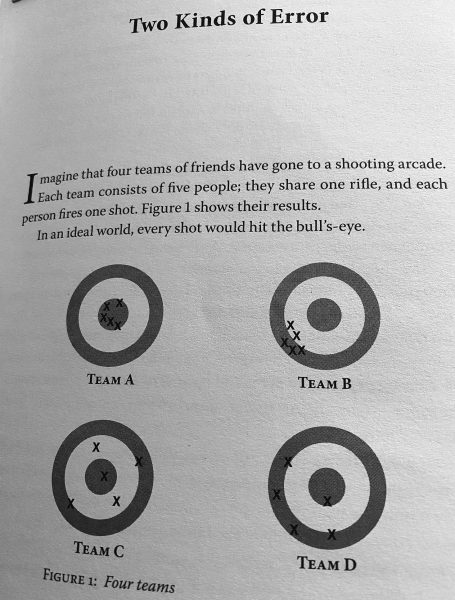
The 3 authors Daniel Kahneman, Olivier Sibony, Cass R. Sunstein have published in 2021 the impressive attempt to sell statistics to non-statisticians. The grip on the topic: “Noise. A Flaw in Human Judgment” is a bit misleading. Even the German translation (“Was unsere Entscheidungen verzerrt”), in my opinion, is grossly misleading. The work deals with judgment, or arriving at a sensible judgment. Decision-making is only the next step with a lot of other intervening processes. The German philosophical term since the enlightenment period has been “Urteilskraft“. We are all more or less familiar with the notion “bias” in judgment. Me, originating from the Moselle, will always be biased in favor of a Riesling compared to other vines. In addition to this naive bias I may apply a more professional judgment on wine. Testing several wines even from the same small area from the Moselle valley and then repeating the tasting I might make a noisy judgment.  “When wine experts at a major US wine competition tasted the same wines twice, they scored only 18% of the wines identically (usually, the very worst ones).” (p. 80). In addition to the previously defined form of “level noise, pattern noise and system noise” (p.77), we have occasion noise, when judgments vary from an overall statistical perspective.
Having received a second dose of a vaccination yesterday and having spent an unpleasant night my judgment for this review might be biased, because of impatience. So in order to reduce bias and variants of noise I shall repeat the review at a later stage. Let’s see what this returns. But for today, the Epilogue “A less noisy world” (p.377) appears rather odd to me. It is probably an illusion to believe that we can create a less noisy world, even with the best of wishes. The authors abstract from any strategic use of noise to influence judgments. The political form of choosing judges for Constitutional Courts in the U.S. needs to be dealt with. Noise in judgments is an important element, but strategic use of bias might be more influential to impact outcomes. Noise, when faced with a judge who has a reputation to be very tough in sentences might be overturned in an appeal court decision. There are plenty of procedural ways to overcome noise in judgments. I agree with the authors that you better know about the noise in judgments than ignore it. Awareness of random errors and noise involved in grading exams and recruitment decisions have determined many excellent “failures” to leave historic contributions to our world. In music, maths or literature some splendid talents probably have been impeeded at earlier stages of their life to make average or normal careers. Some of them left us with fantastic pieces thanks to the noise in judgment of others.
There seems to be an age bias in the tolerance of noise in the acoustic sense. Noise in the statistical sense has left a strong mark on me when I learned about white noise as error or stochastic process.
Image Kahneman, Sibony, Sunstein 2021. p3.

Covid-19 USA

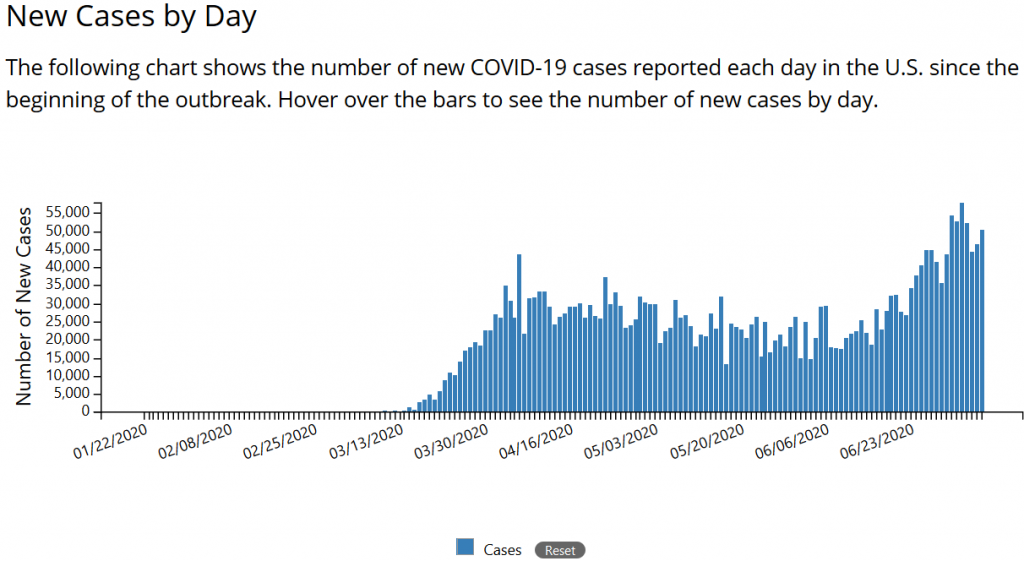
With almost 6 months into COVID-19 in the USA since the first official case, the public health situation is still scary. Data and figures from the official U.S. Department of Health & Human Services, particularly the recent data release from the Centers for Disease Control and Prevention show around 50.000 new cases of Covid-19 every day again (see figure).

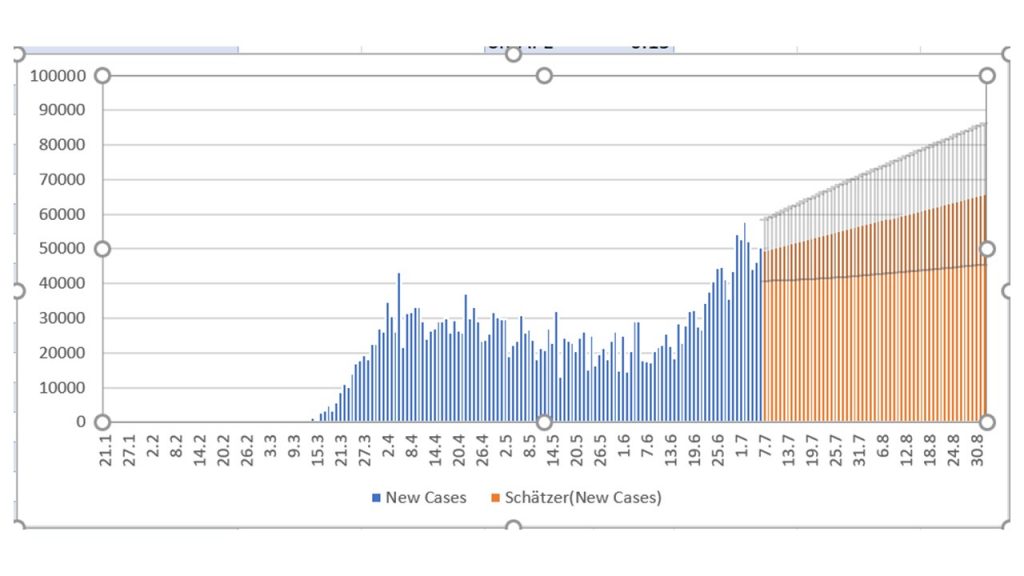
By using the data and calculating a simple linear trend shows the following evolution in case no policy change occurs.

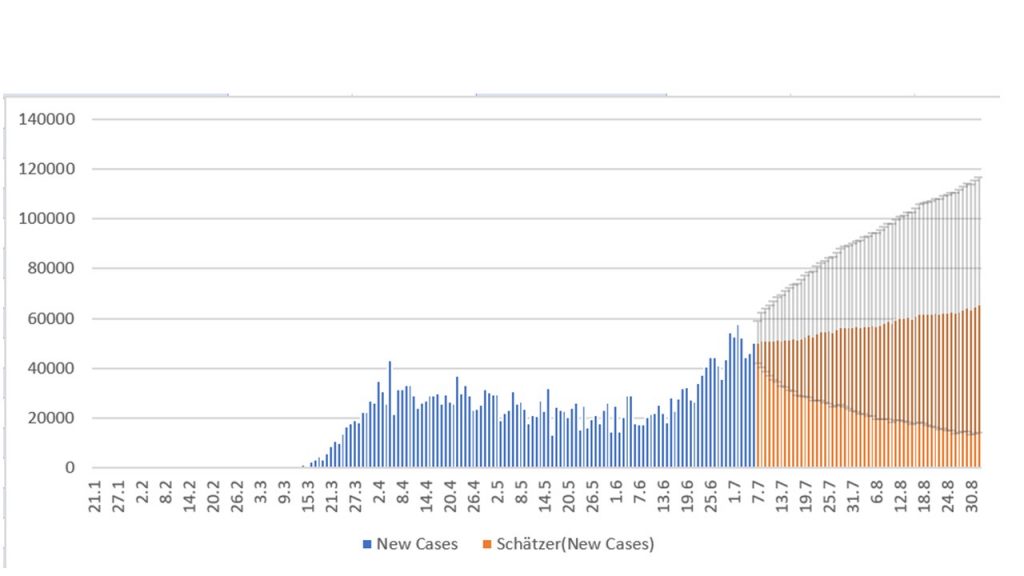
Using a seasonality in the calculation of about 3 weeks (=20days) the evolution looks much different with huge margins of error.

Hence, all is possible by chart analysis or the language of investors. Public health analysts would rather look at the disaggregated state by state or even county be county detailed analysis. A seasonality of 3 weeks could make sense. With a high level Covid-19 cases in one state people move (also with Covid-19) to other states for one week exporting the virus. After 2 more weeks incubation, case numbers rise in this receiving area, which will make visitors (and the virus) move back again. A oscilating pattern of the spread of the virus will result, making a nationwide lockdown much more likely. In natural sciences (Video-Link)we call this coupled oscillation, here of Covid-19 between several US-states. (take Florida and New York for example).
Now, let us apply the same simple statistical modelling to the international level. As we enjoy Summer in Europe , in the southern hemisphere of the world Winter, Covid-19 and the flu are spreading there now. When we shall move from Autumn to Winter, we might receive another wave of cases from the other part of the world.
Conclusion: Get prepared for another wave as of now. Helping the global South now, saves lives in Autumn and Winter also in Europe. Simple isn’t it. Let’s just act accordingly (the not so simple part). Train health care professionals (95.000 of them got infected in the US and 500 !!! died).