The construction of a knowledge graph is like an exercise in visual thinking or image thinking. A common method in design, visual thinking uses graphical tools to visualize ideas and develop the ideas on the basis of these visuals. So, let’s take our ABC of notions running from action … over nature … to zero. We place these notions in the core of the knowledge space and develop the satellite combined notions around the core. Visually this is easily reflected in the figure below. Content-wise a lot of thinking has to fill the combinations and check empirically this mind map of the knowledge space. Abundant complexity will let us search for digital tools to accomplish such tasks. On this webpage we find already a cloud of words that is empirically showing biggest the words with the most entries of the same key word. This shows us visually what this blog is mainly about. Europe and democracy appear fairly big. Additional analytical tools will clarify what are major or minor links to this pair of notions. “There’s something on my mind”, something which I might not even be aware of. Just an empirical question, should be easy to solve, eventually. 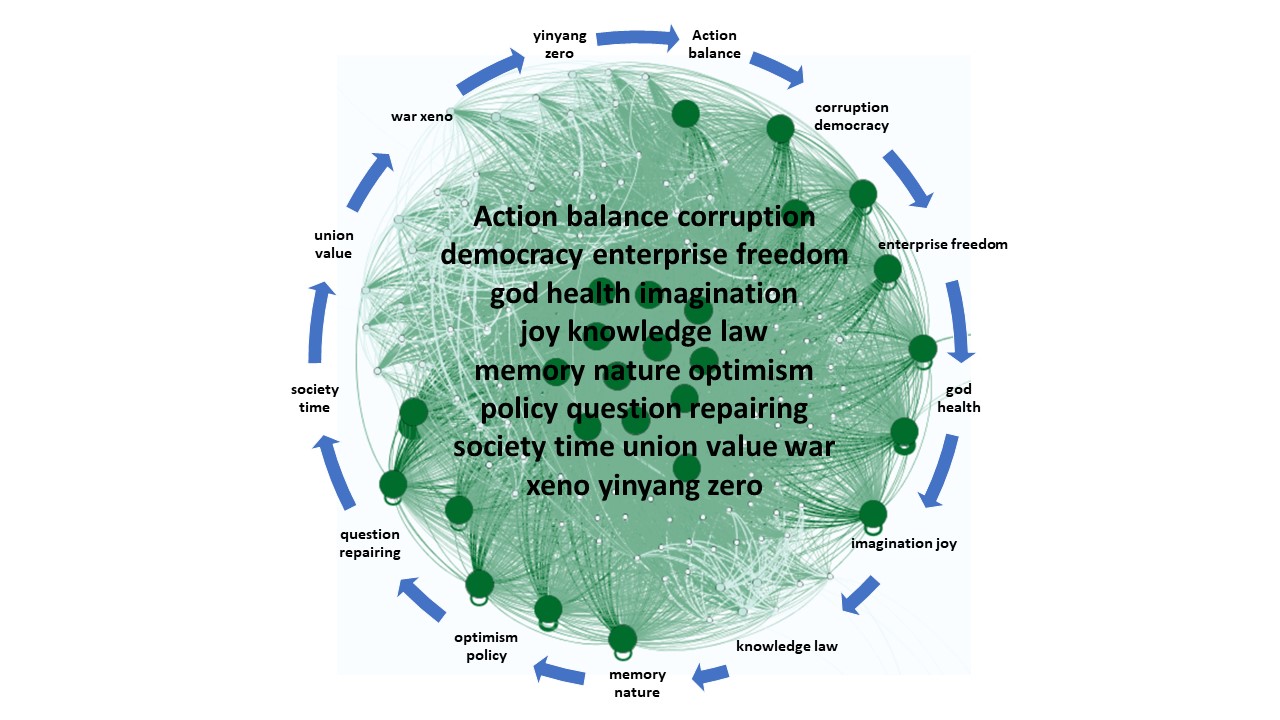

Research Teaching Consulting